Predicting How the Market Will Open Tomorrow
Predicting the Future
One weekend there was bad economic news, and I was wondering how it would impact the market at open on Monday. I looked into this question, and I learned that while the stock market is closed, futures trading of underlying indices continues, and we can look to the futures market to understand how traders are already reacting to and pricing in new information - like a crystal ball 🔮.
As future prices and current prices are related, we can calculate what the futures markets are pricing as the current fair value of each index by discounting the future value backwards in time. This gives us the implied opening price of each index even before the market opens - so on Sunday night we can see whether the market will likely open higher or lower the next day.
Below, I walk through all the pieces of this calculation, culminating in a dashboard I built that gives us a sneak preview of the the next day’s opening movements at impliedopen.com.
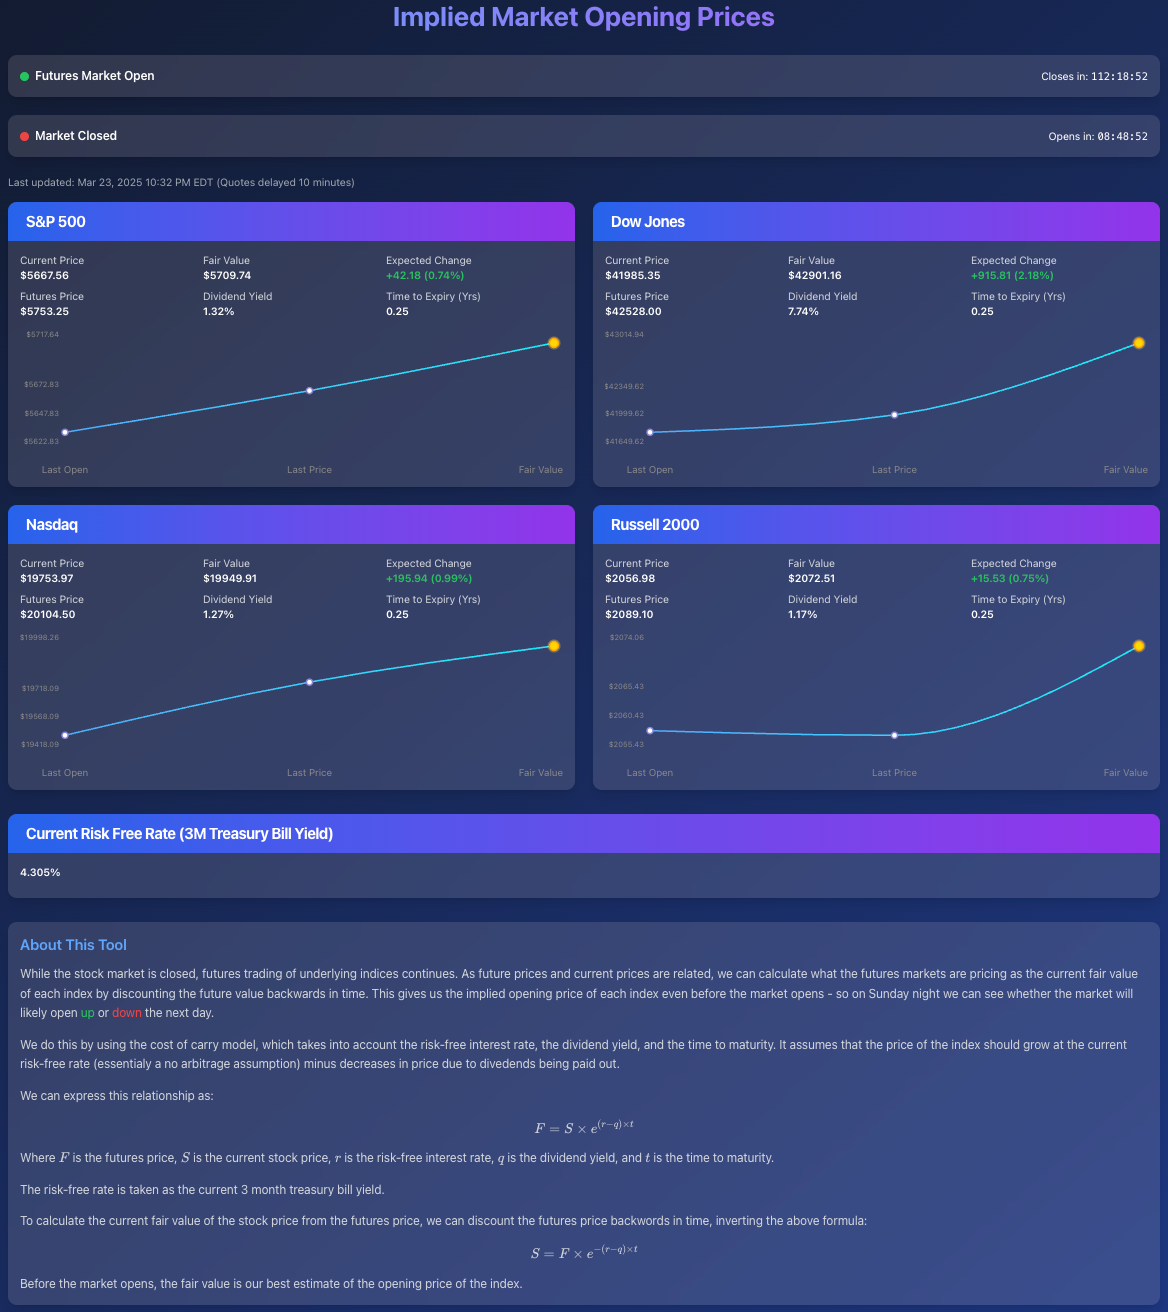
A preview of the dashboard I built which gives us a sneak peek of market movements the next day.
Futures
Futures (future contracts) are instruments that allow traders to bet on the future price of an underlying asset at the future contract’s date of expiry. Note the price and expiry date of the SP500 future below. It’s currently trading higher than the SP500 price, but what does this tell us about what the current value of the SP500 is?
To relate the futures’ price to the current fair value being priced by the futures market, we have to account for the time between now and the future expiry date.
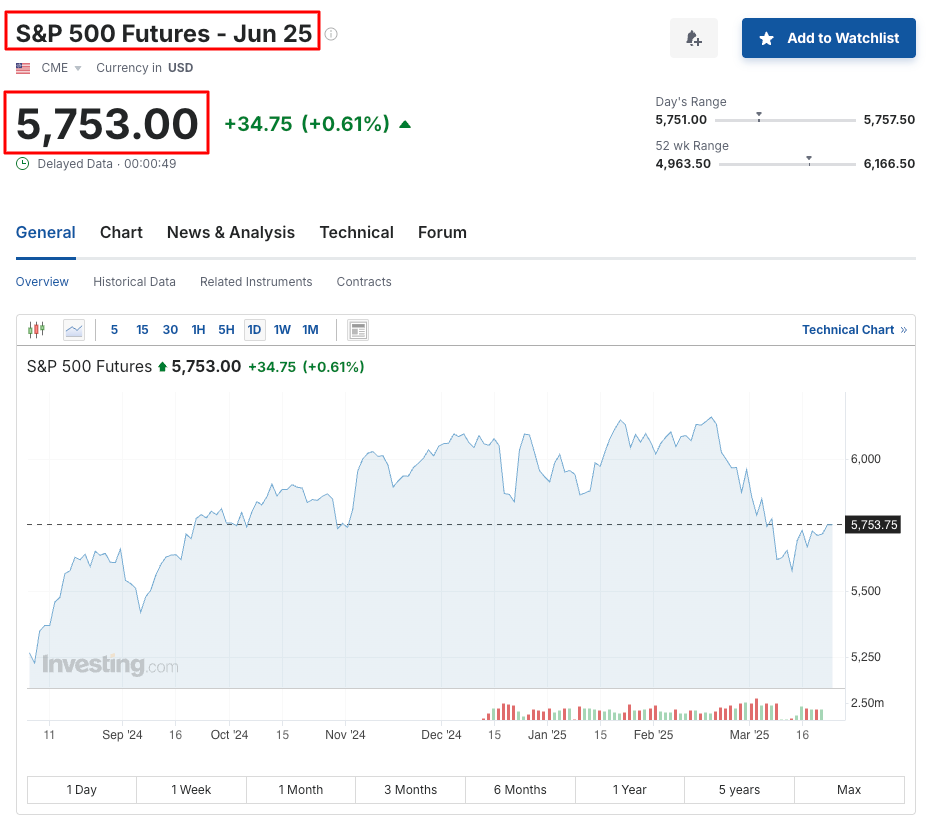
SP500 Future Contract
We do this by using the cost of carry model, which takes into account the risk-free interest rate, the dividend yield, and the time to maturity. It assumes that the price of the index should grow at the current risk-free rate (essentialy a no arbitrage assumption) minus decreases in price due to divedends being paid out.
We can express this relationship as:
where \(F\) is the futures price, \(S\) is the current stock price, \(r\) is the risk-free interest rate, \(q\) is the dividend yield, and \(t\) is the time to maturity.
Going Back in Time
To calculate the current fair value of the stock price from the futures price, we can discount the futures price backwards in time, inverting the above formula:
Before the market opens, the fair value is our best estimate of the opening price of the index.
Risk Free Rate
Does a risk-free investment even exist? Well, treasury bills - debt issued by the US treasury - are considered (nearly) riskless because:
- US government has a low chance of default; it can print its own money has a good history of paying debts
- short maturity reduces exposure to interest rate changes and long-term uncertainties
- very liquid market
- no credit risk as the US government won’t go bankrupt like in the case of corporate or municipal bonds
For the risk-free rate in these calculations, I choose the 3 month T-bill.
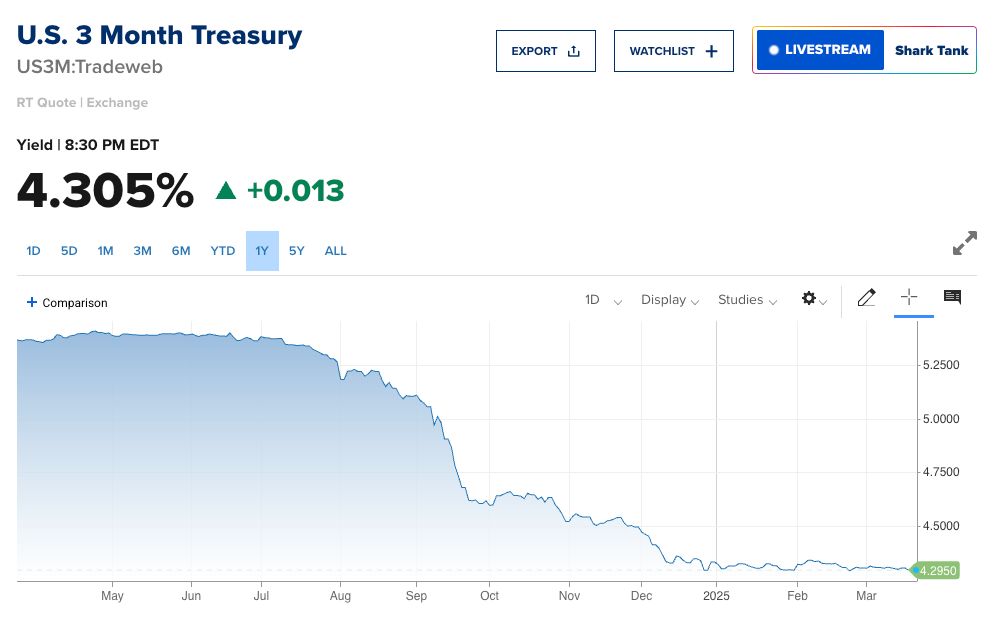
3 Month US Treasury Yield
We assume that the underlying assets will grow at atleast the risk-free rate, because otherwise investors wouldn’t bother putting their money in these instruments.
Dividend Yield
While we assume that the underlying instruments will grow at atleast the risk-free rate, we have to account for the fact that the underlying indices will drop when dividends are paid out by a commensurate amount. To do this, I am using the most recent dividend yield of each index - but a more accurate model will probably anticipate what the forward looking dividend yield will be.
Below is the latest SP500 dividend yield which I use for my calculations.
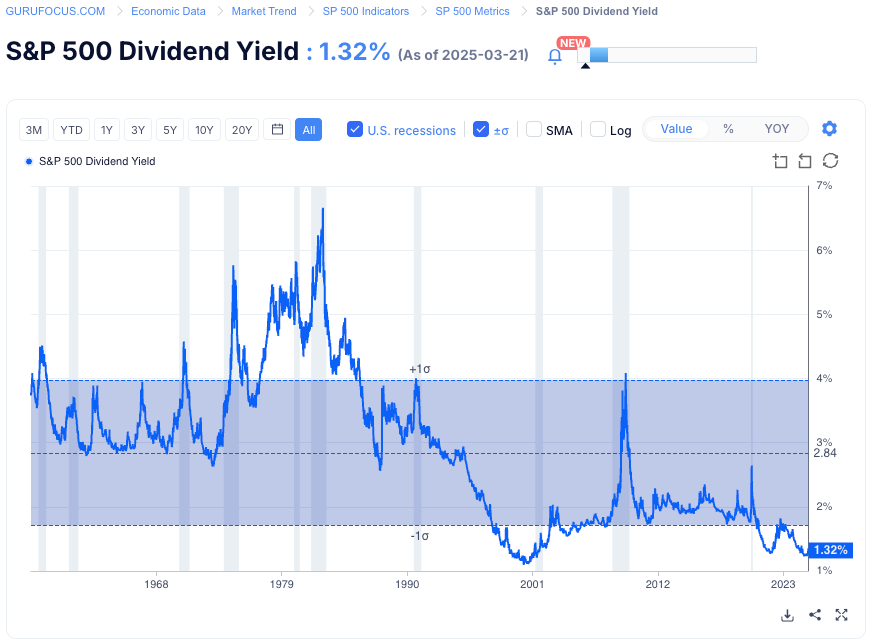
Latest SP500 Dividend Yield
Putting it All Together
I collect the last index price, the current trading futures price, my best estimate of the dividend yield, risk-free rate, and time to expiry, and calculate my current best estimate of the fair value of each major index. I’ve put all the pieces together on impliedopen.com, which I’ve embedded below:
This dashboard is most useful when the futures market is open but the regular market is closed - so we can use the futures market to understand what traders are pricing in before the regular market open. When the regular market is open, it provides the “true” current value of each index - as priced by the market.
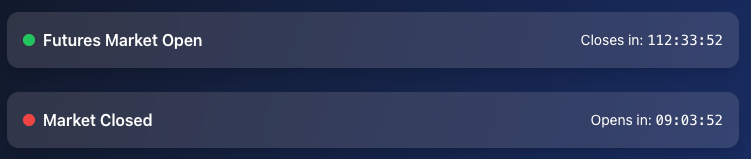
Market Status View
Final Notes
I put this dashboard together pretty quickly, and ended up just scraping a lot of the values which I cache once a minute on my own API :) My apologies if things break or it goes down - at some point I will replace things with proper APIs, or this dashboard will become irrelevant as markets move towards 24/7 trading. In any case, I wanted to put together this blog post for permenance.
It is what it is.
If you notice errors in my calculations or have suggestions or other feedback, please reach out to me and let me know!
